Cloud Reports
Estimated Reading Time: 9 MinutesOverview
The purpose of this feature is to be able to deploy new reports that are specific to doctors and their practice needs quickly and in formats that better serve their needs. The user will be able to log in and select criteria for their reports in an easy-to-use fashion. An Excel spreadsheet is the primary format for all of these reports. Another purpose of this feature is that we can deploy new reports without having to redeploy TDOffice.
Prerequistes
Available for users with TDO Cloud services.
Detailed Steps to open Cloud Reports
Report is located in: Main>Reporting Tools>Open Cloud Reports
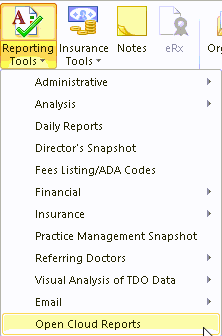
TDO Cloud Reports will open.
Some Cloud Reports can also be accessed via the Admin Login portal of your TDO site. See this article for instructions.
List of Reports
- Financials
- Aging Analysis
- Bank Deposit by Date
- Busiest Day
- Case Disposition List
- Case Summary
- Code Breakdown by Date Range
- Code Breakdown by Multi Fee ID
- Collection by Codes
- Completed Cases by Completed Date Range
- Credit Balances Broken Down by Location and Doctor
- Daily Breakdown by Month of Collection and Production
- Debit and Credit Adjustments
- Insurance Claims Broken Down by Location and Doctor
- Monthly Snapshot
- Outstanding Claims by Insurance Carrier
- Outstanding Claims Consolidated List
- Patient Insurance List
- Patient Production by Date
- Procedures with NO Claims
- Production\Collection by Month
- Snapshot Summary
- Snapshot with Other Breakdown
- Patients
- Referring Doctors
- All Referring Doctor List
- Patient Referred and not Scheduled
- Referrer Annual Report
- Referrer Annual Revenue Report
- Referrer Annual Revenue Report by Date Range
- Referrer Revenue Alerts
- Referring Doctor Events
- Referring Doctor List by Created Date
- Referring Doctor Total Patients and Total Billed
- Referring Dr. Rank by Total Billed
Financials
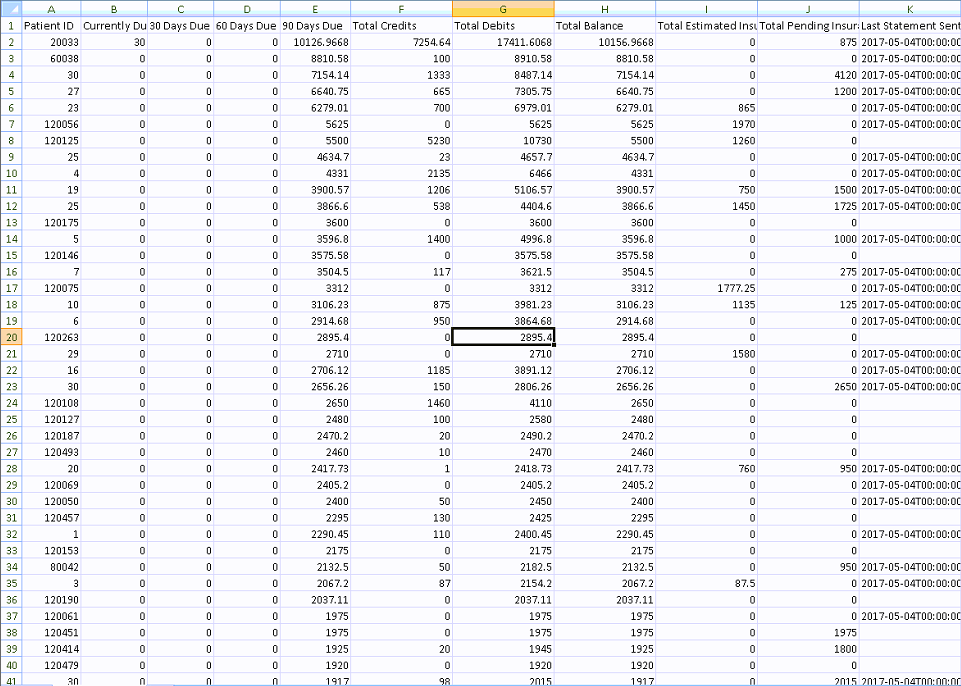
Aging Analysis
This is similar to the Aging Analysis function found in TDO: [Reporting Tools > Financial > Aging Analysis]. No parameters need to be specified when generating this report, the spreadsheet generated will have a row for every patient who has a balance. There will be separate columns for: [Balance] Currently Due, 30 Days Due, 60 Days Due, and 90 Days Due, etc.
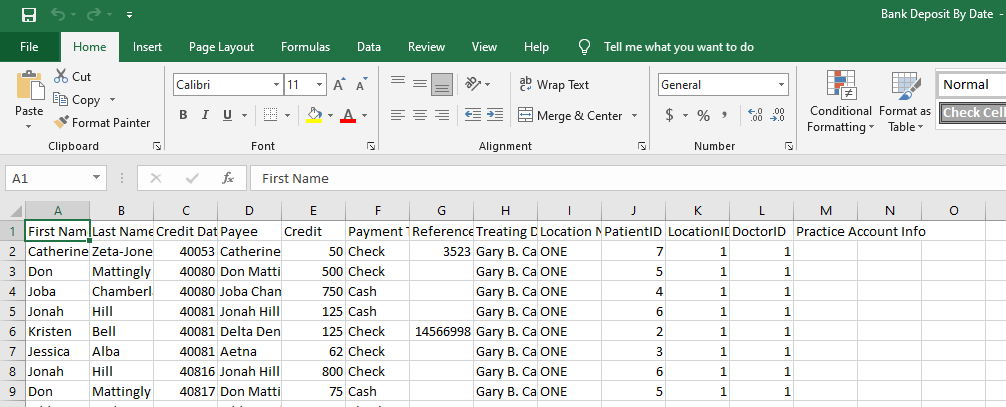
Bank Deposit by Date
Show Deposits by date, Similar to Reporting Tools> Financial> Reports by Date> Bank Deposits by Date
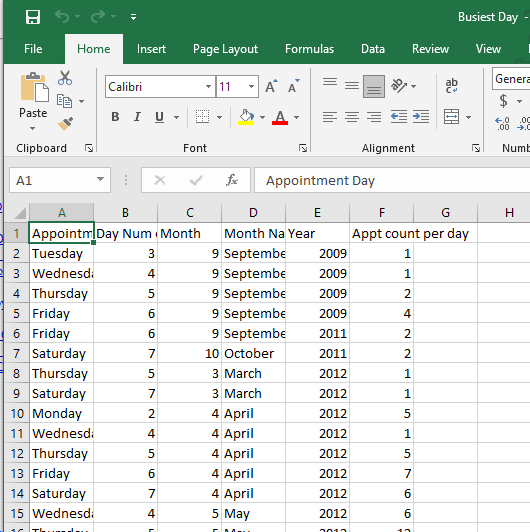
Busiest Day
This report will allow the users to find out which days of any given date range is typically the busiest. To Generate the report:
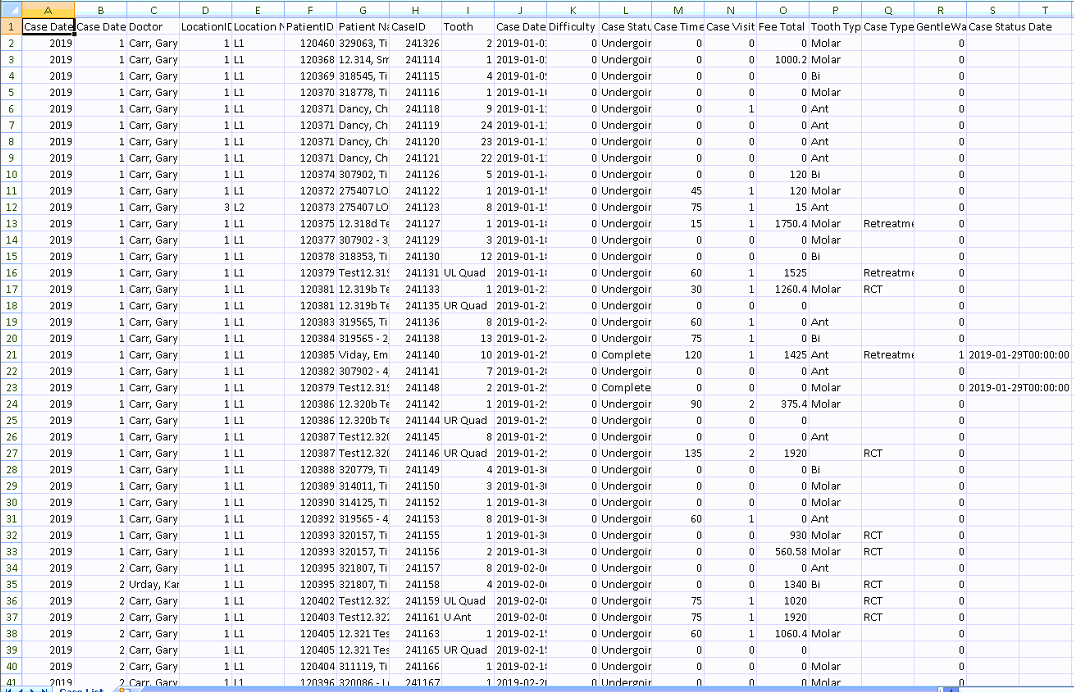
Case Disposition List
There are columns indicating Case Status, Number of Visits, Fee Total, Tooth Type, Case Type, and whether or not the GentleWave Procedure was marked in the Treatment page for that case.
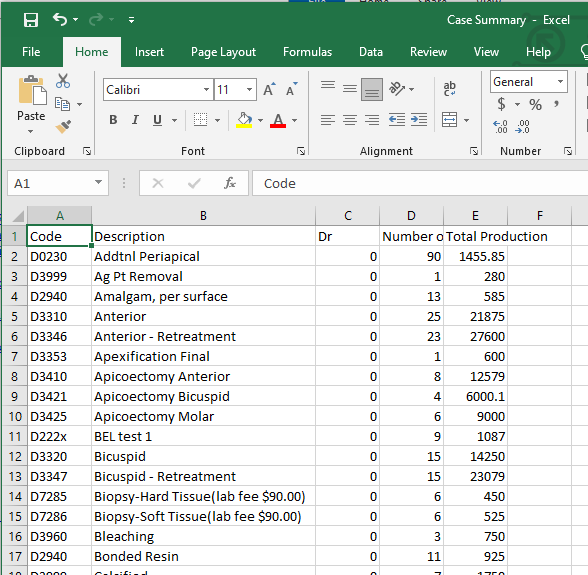
Case Summary
This report will list all the procedures performed by providers on any given date range specified. The report will show the procedure codes, description, Doctor ID (ID 0 is for practice), number of procedures, and total production.
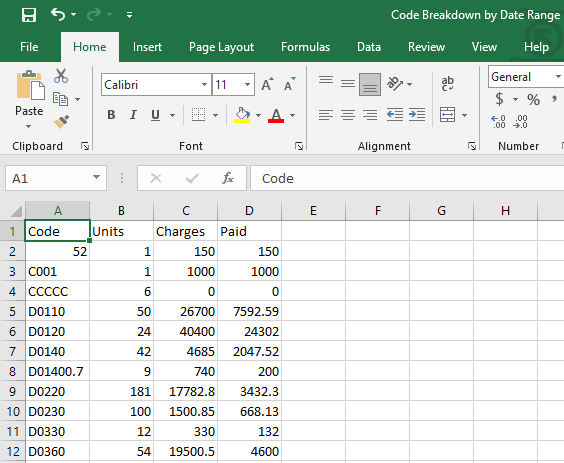
Code Breakdown by Date Range
Breaks down the usage of each code with a date range
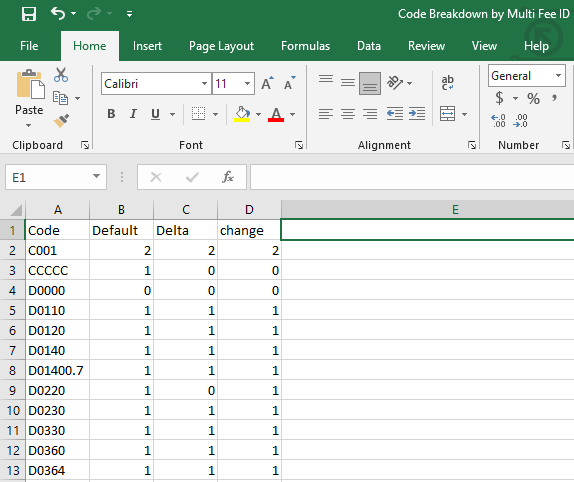
Code Breakdown by Multi Fee ID
Breakdown of each time a code is used within a multifee schedule
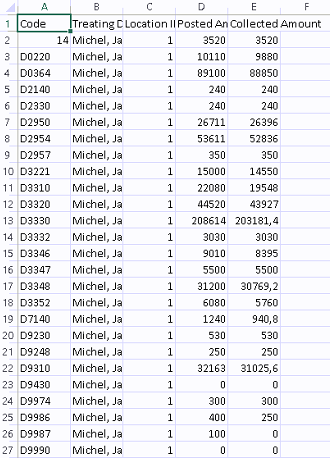
Collection by Codes
This report consist of two sheets, Codes by Doctor and Code Totals. Codes by Doctor breaks has a row for each column, separated by Treating Doctor and Location. Code Totals combines each doctor’s production and collection for each code into a single row (one row per code). Each sheet has columns for the Posted Amount and Collected Amount for each code.
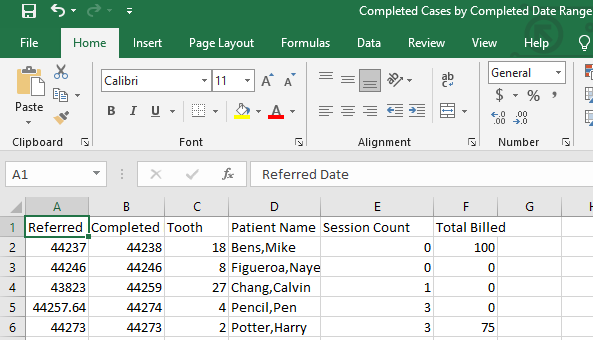
Completed Cases by Completed Date Range
This report allows you to analyze how the ’Treatment Sessions’ count affects your production for a case.
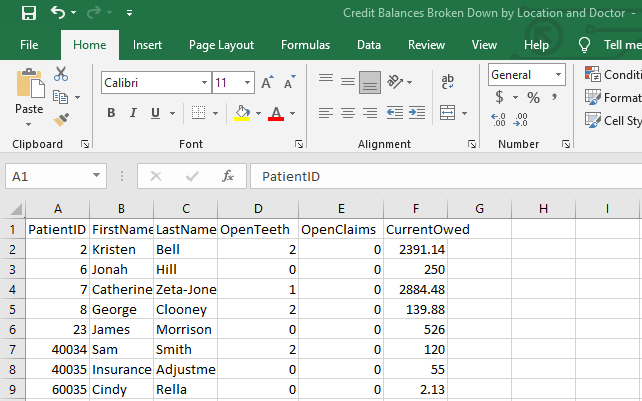
Credit Balances Broken Down by Location and Doctor
Report will show the Patient Name and ID number, How many teeth are left Open, How many Claims are Open, and the current amount owed.
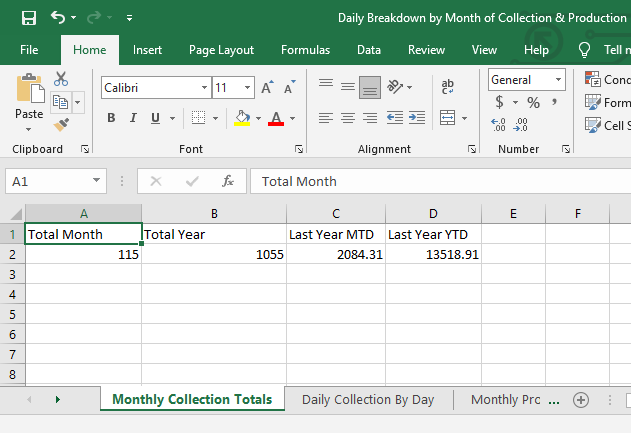
Daily Breakdown by Month of Collection and Production
Report will show Monthly Collection totals, Daily Collection by Day, Monthly Production, Daily Production by Day
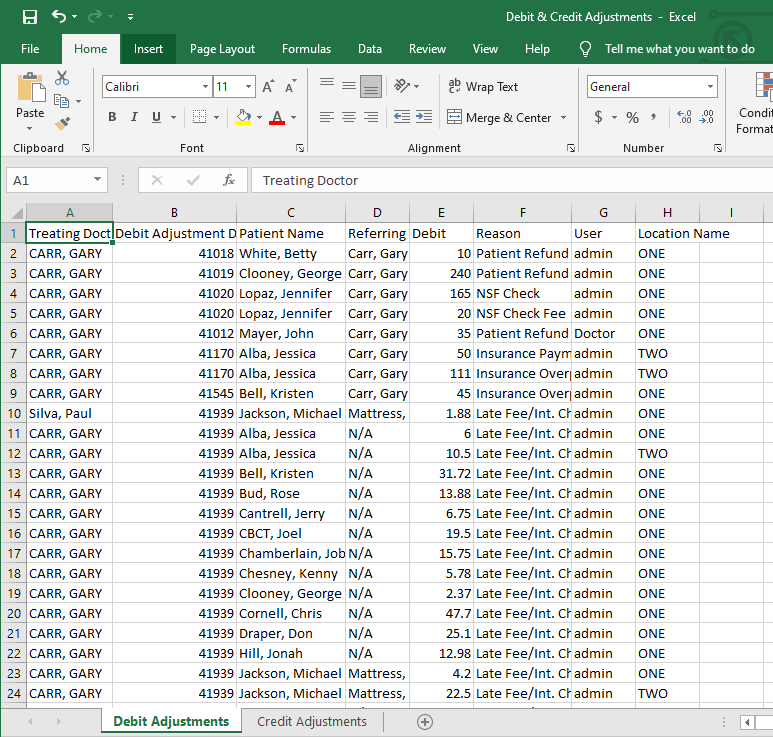
Debit and Credit Adjustments
The report will show the Adjustments and Reason
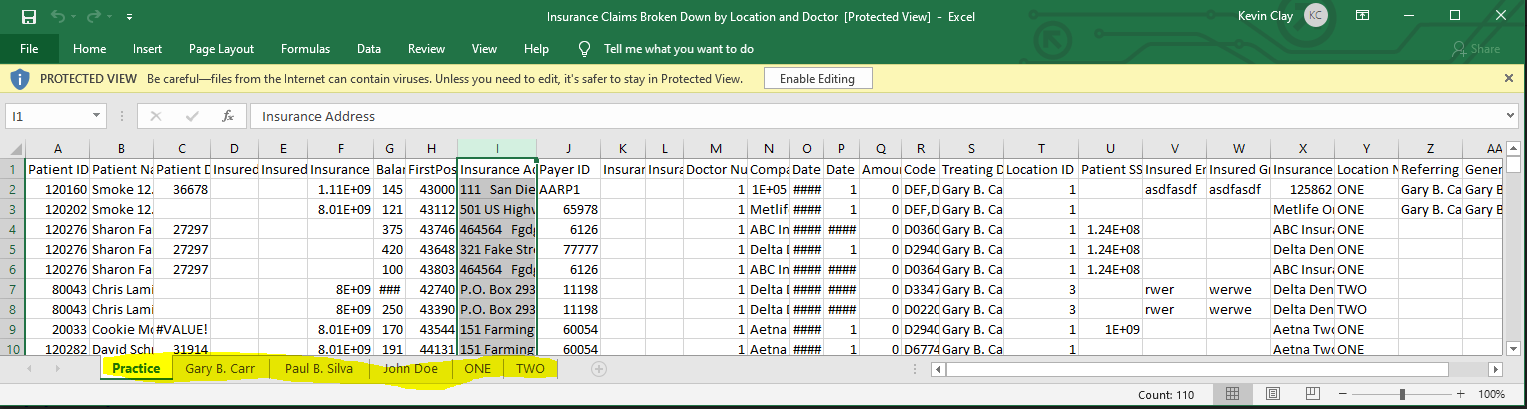
Insurance Claims Broken Down by Location and Doctor
Report will show the following
Patient ID Name, Social Security Number, and Date of Birth
Insured Name, Employer Name, Group ID Number, Phone Number and Social Security Number
Insurance Co Phone Number, Insurance Address, Payer ID, Insurance Co Contact, Insurance Co Fax, Insurance Company Name
Balance
First Post date
Doctor Number
Date the claim was Sent and Received, and amount Received
Fee/Codes on Claim
Treating Doctor
Location ID and Location Name
Company Name
Referring Doctor and General Dentist
This report is broken down by
Practice, Doctor, and Locations as individual tabs
Practice Tab: Assigned claims for the practice between the dates selected.
Doctor Tabs: Assigned claims, between the dates selected, for broken down by treating doctors.
Location Tabs: Assigned claims, between the dates selected, for broken down by locations.
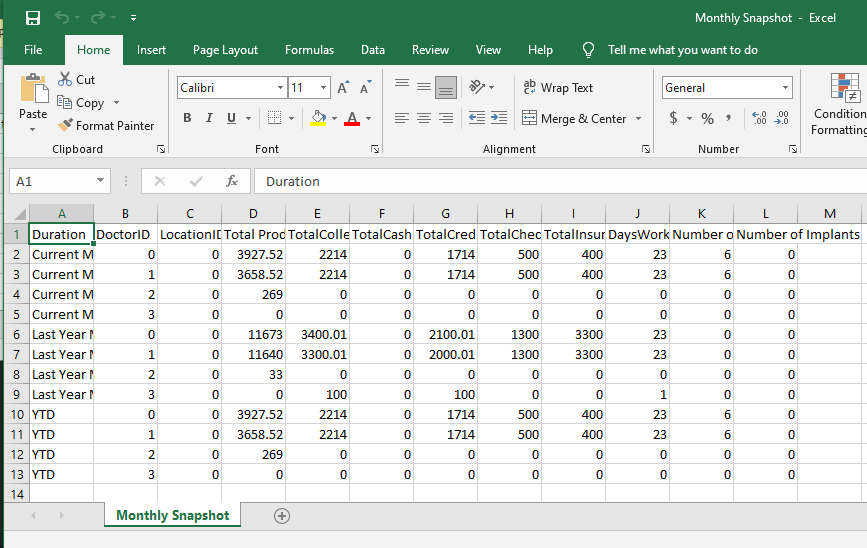
Monthly Snapshot
This report is broken down by the two tabs at the bottom - one looking from a location perspective and the other from the doctor perspective.
This report is good to compare current month and current year to date with previous year’s month and previous year’s year to date.
Report Month: enter the month in numbers. For example: 1 or 01 for January, 2 or 02 for February and so on.
Report Year: type in the year
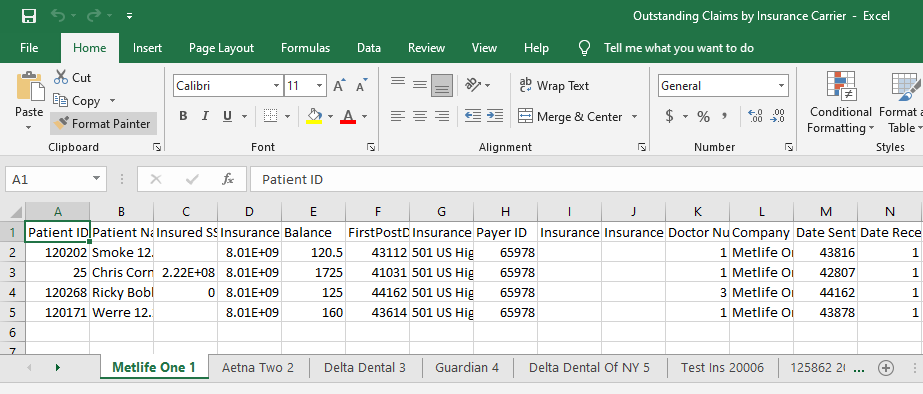
Outstanding Claims by Insurance Carrier
Report Shows Patients with Outstanding claims broken down by Insurances
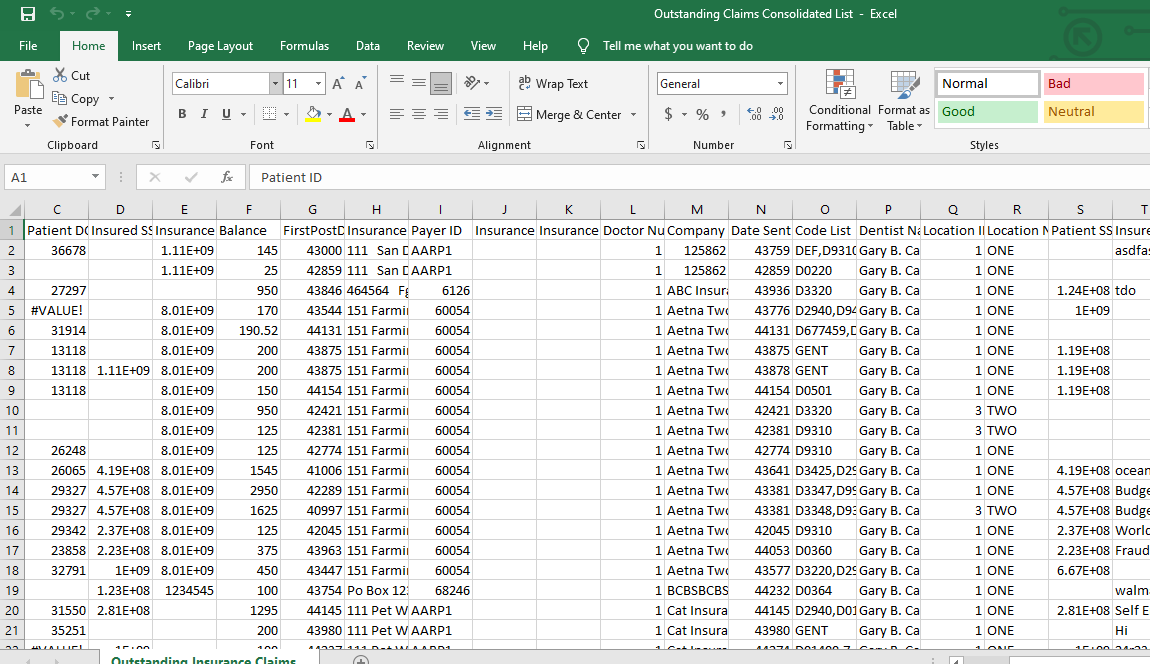
Outstanding Claims Consolidated List
Report Shows Patients with Outstanding claims on one sheet
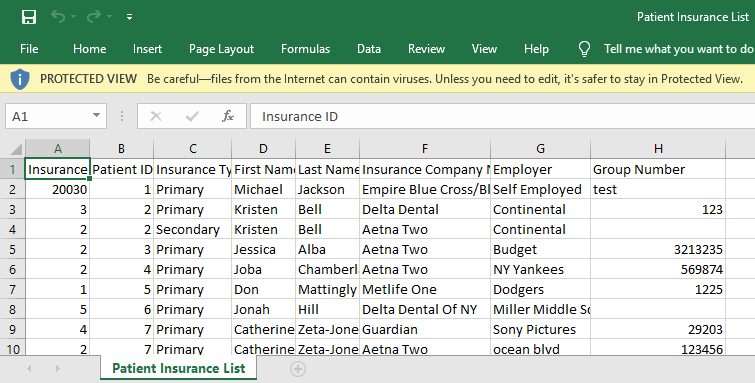
Patient Insurance List
List of patients with primary and secondary insurance
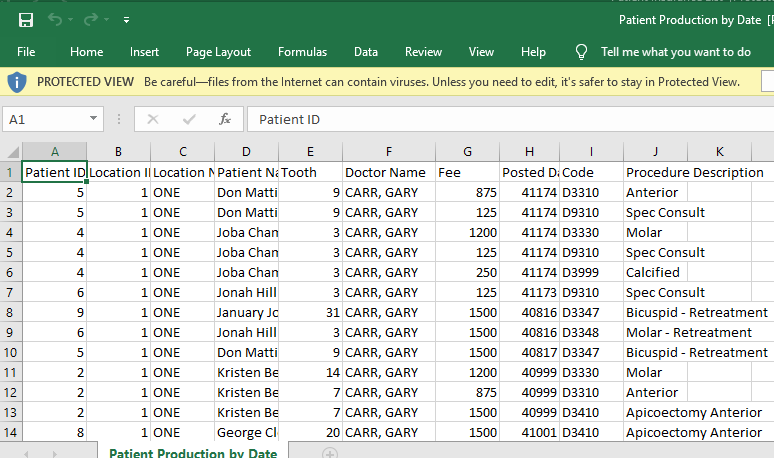
Patient Production by Date
The report shows patients' production with codes and dates
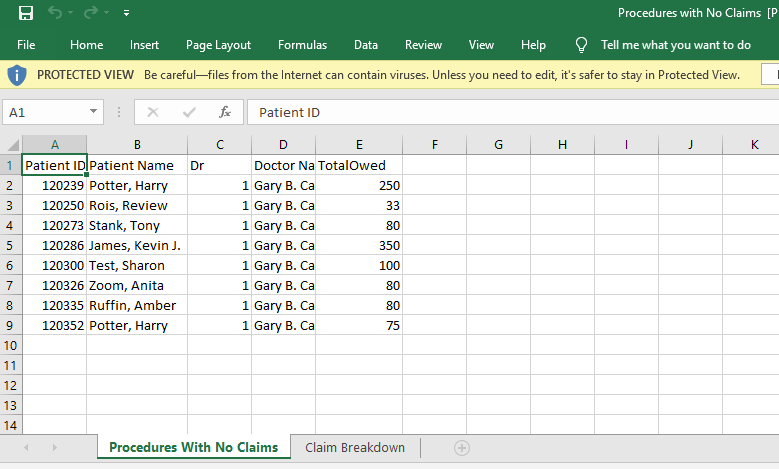
Procedures with NO Claims
This report will list all patients with procedures not attached to claims. The patient must have a valid insurance carrier added to his/her chart.
This report will show the amount owed by patients and the Claim Breakdown.
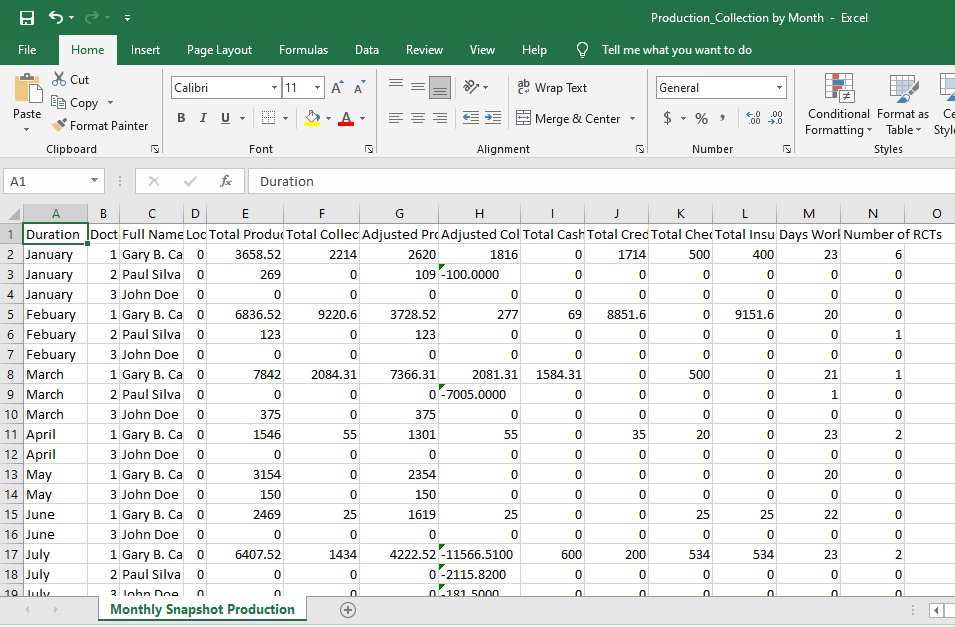
Production/Collection by Month
Production, Collection, adjustments by Doctor by Month
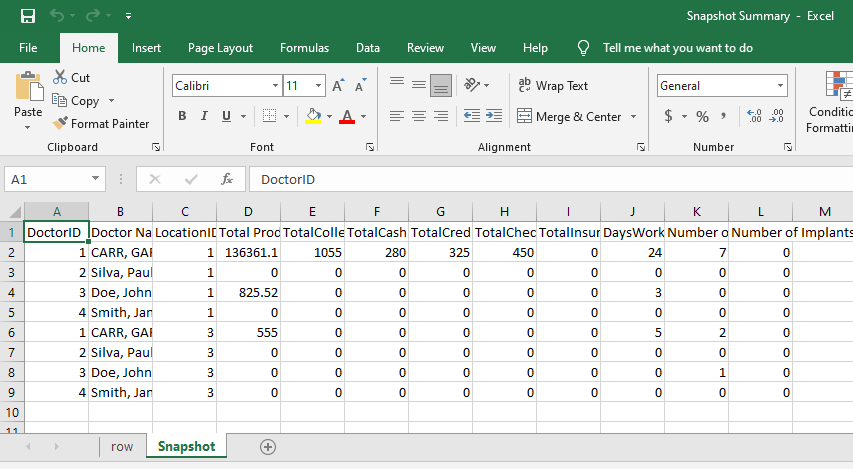
Snapshot Summary
This report is similar to Monthly Snapshot with the difference that users can generate the report for any date range specified. This report can be generated for a quarter, 2 weeks, 6 months, a year, etc.
This report will show Production, Total Collection, Total Cash, Total Credit Card, Total Checks, Total Insurance, Days Worked, Number of RCTs, and Number of Implants
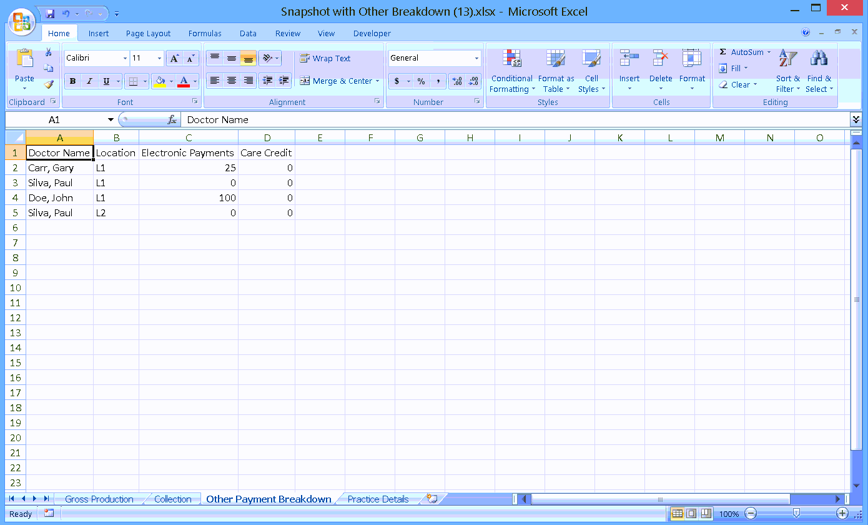
Snapshot with Other Breakdown
This report will show all the other types of payments broken down so users know the amount collected from other payments on a given date range.
This report has four different tabs:
- Gross Production tab: will show the Total Production, Adjusted Production, Total Billed MTD, Total Billed Last Year MTD, Total Billed YTD, and Debit Adjustments, by Doctor by Location; just like in the Snapshot report in TDO.
- Collection tab: will show the Collections the same way as in the Snapshot Report in TDO: Total Cash, Total Checks, Total Credit Card, etc. by Doctor by Location.
- Other Payment Breakdown tab: will show the payments collected from other types of payments such as Electronic Payments or any other custom type of payments; by Doctor by location.
- Practice Details: will show shows some great information including number of new referrals, cases started, cases completed, number of emergencies, treatment time and waiting time, by Doctor by location.
Patients
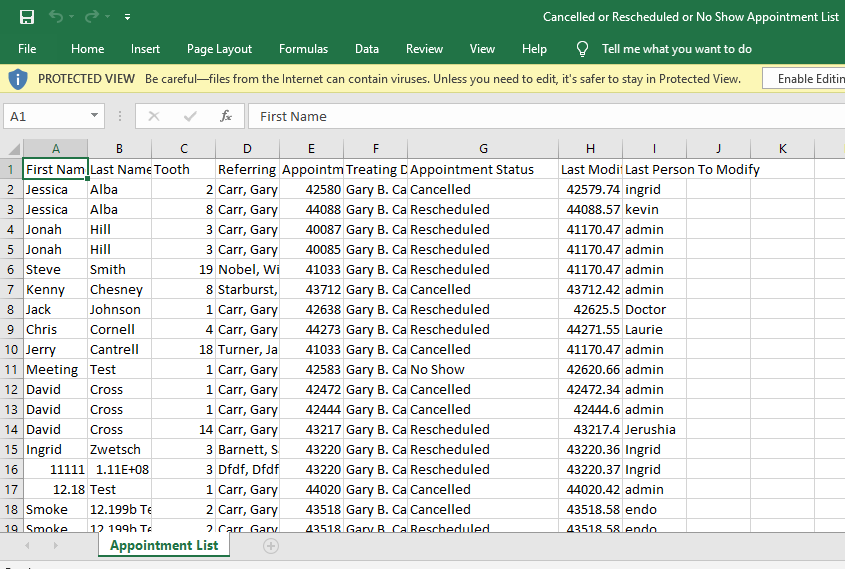
Cancelled or Rescheduled or No Show Appointment List
This Report will show you all Cancelled, Rescheduled, or No Show Appointment List and who was last to modify the appointment
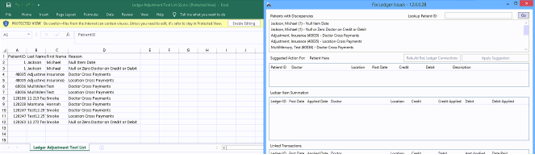
Ledger Adjustment Tool List
This report will allow users to get a list of the charts they need to review.
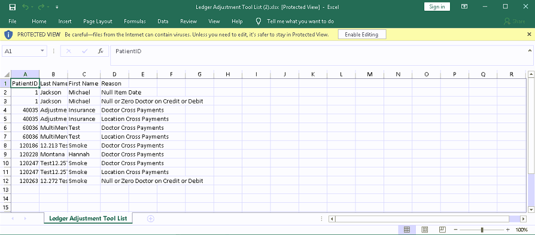
This report will match the list of patients with discrepancies from Administrative>Ledger Adjustment Tool
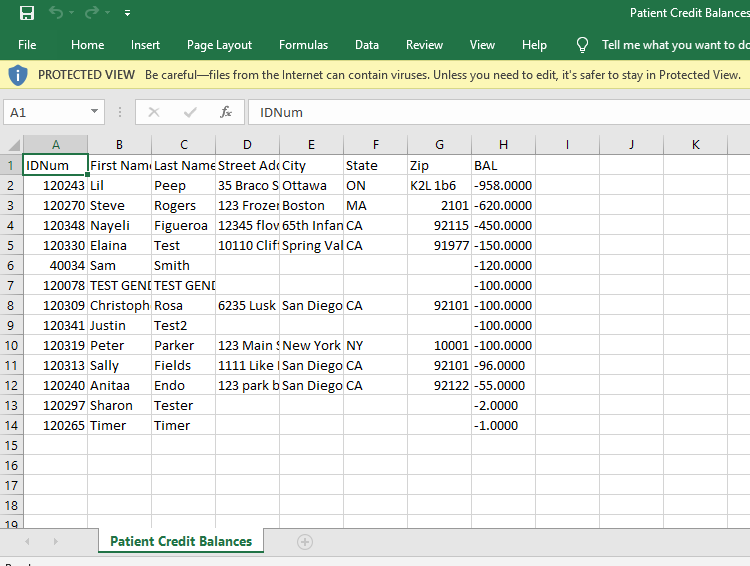
Patient Credit Balances
Report shows patients with Credit Balances
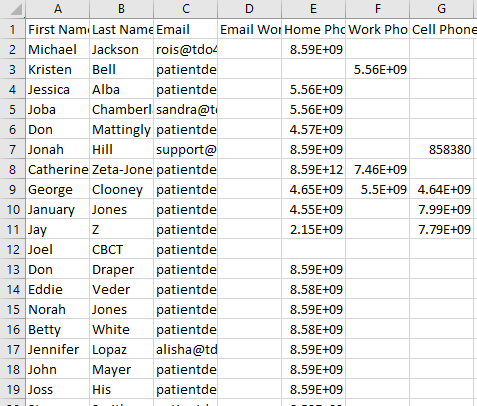
Patient List
This report will list all patients in the database, along with their contact information.
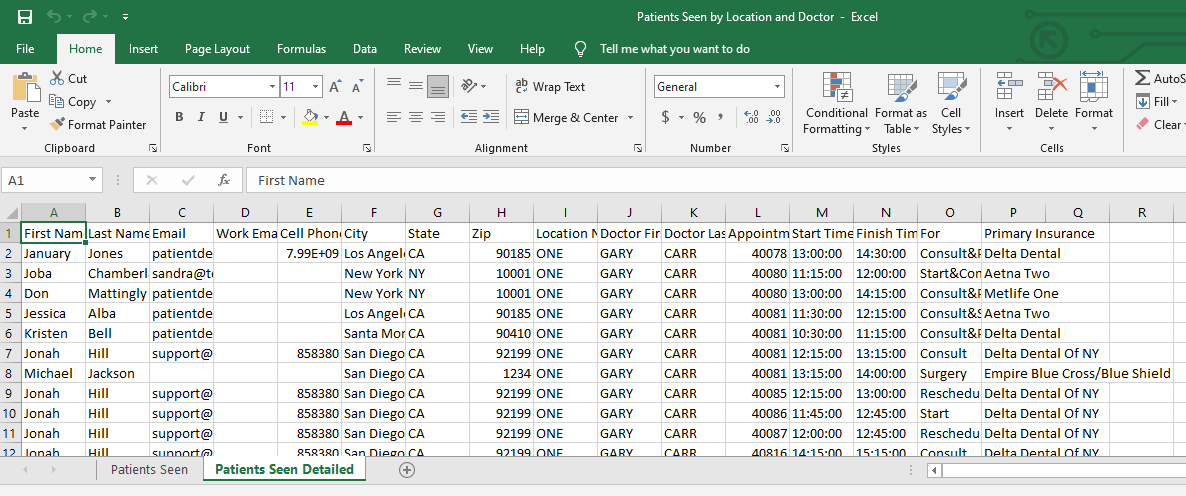
Patients Seen by Location and Doctor
This report allows users to see all patients seen by location and doctor.
Referring Doctors
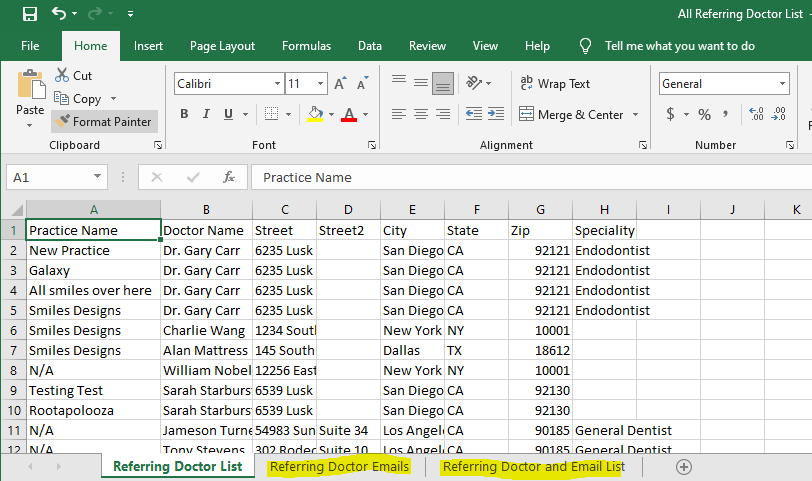
All Referring Doctor List
This report will allow users to create a mail merge for referring practices.
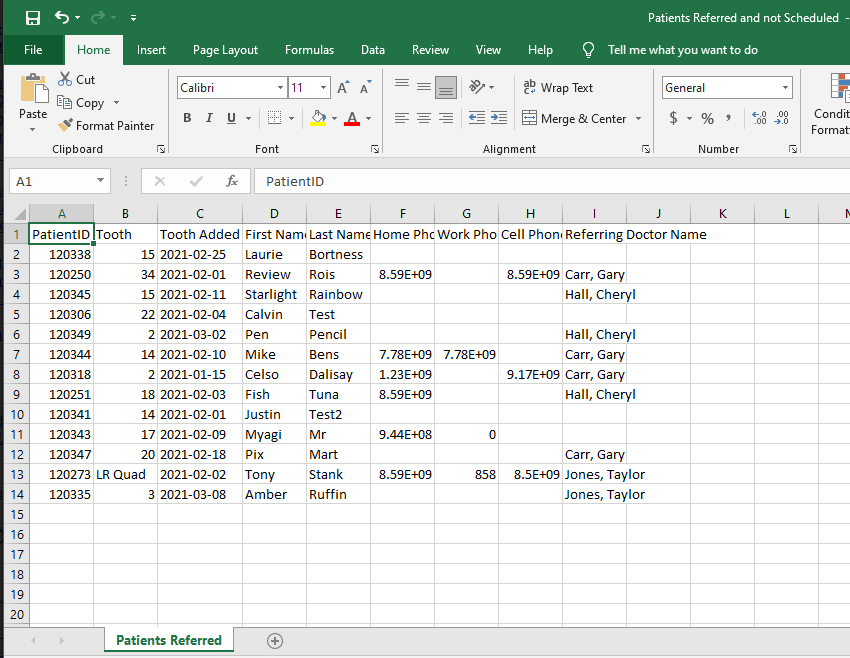
Patient Referred and not Scheduled
This report with show patients who have been referred and are currently not scheduled by date range.
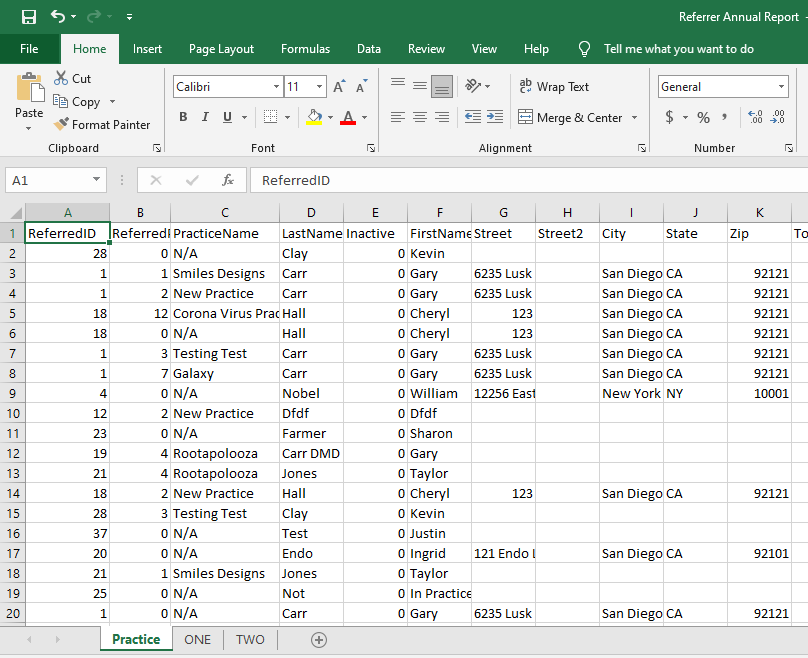
Referrer Annual Report
The referral ranking report is the perfect place to see how many patients were seen for Consult and Treatment on a yearly basis.
Report Year: Enter in the year the report needs to be generated in.
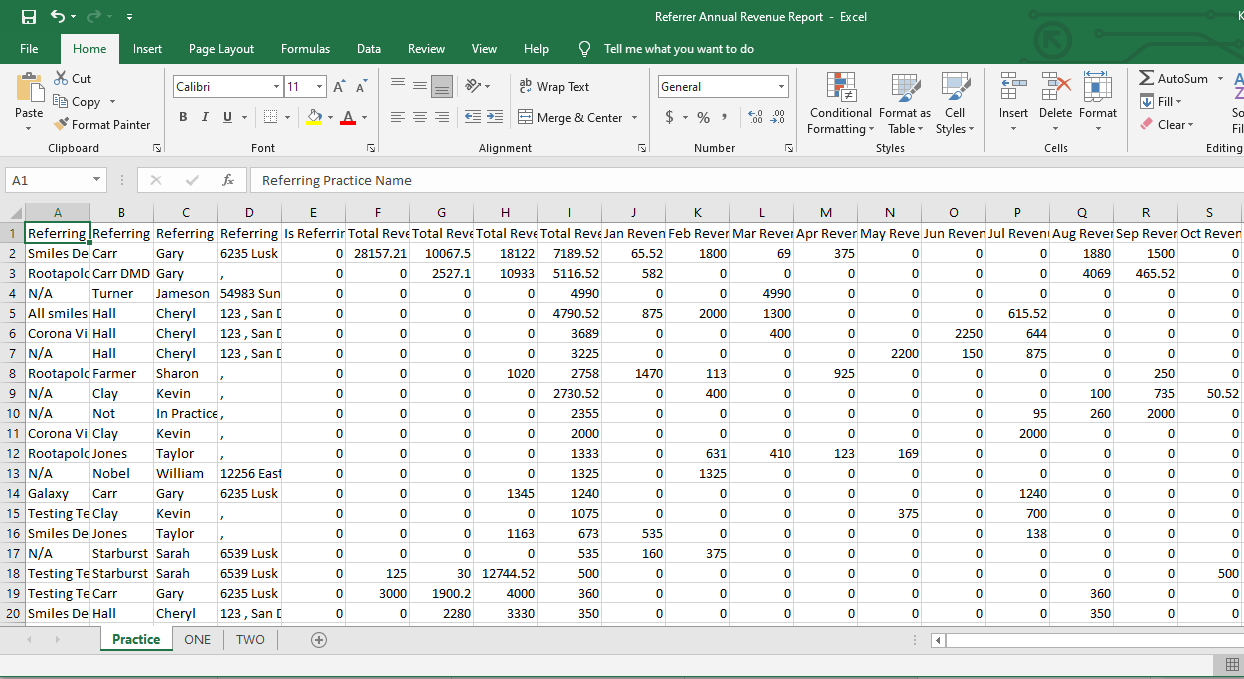
Referrer Annual Revenue Report
This report will show revenues by referring doctor broken down by month for a calendar year. Annual revenues for the previous 3 years are also shown for comparison. The report can be viewed by practice as well as by location.
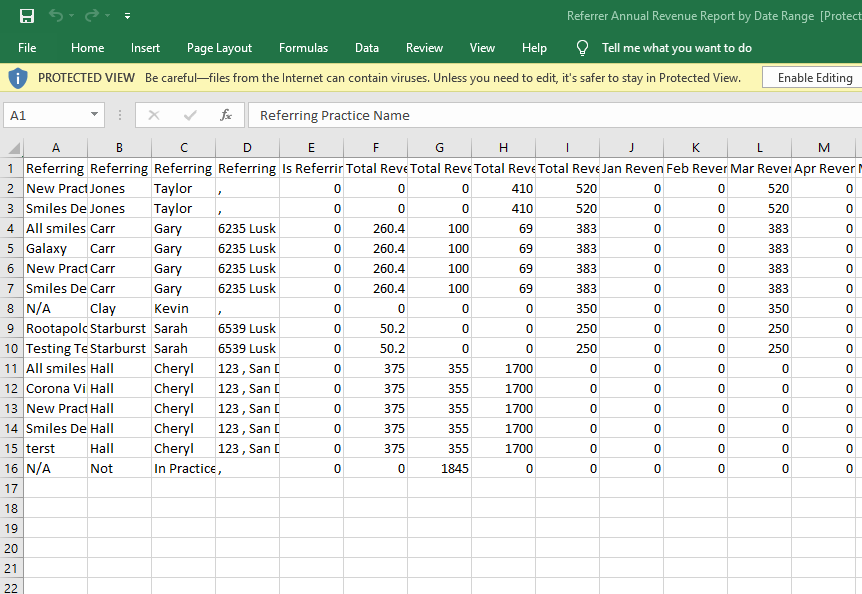
Referrer Annual Revenue Report by Date Range
This report will show revenues by referring doctor broken down by month for a calendar year. but you can manually select the date range. Data will only show for that Date Range
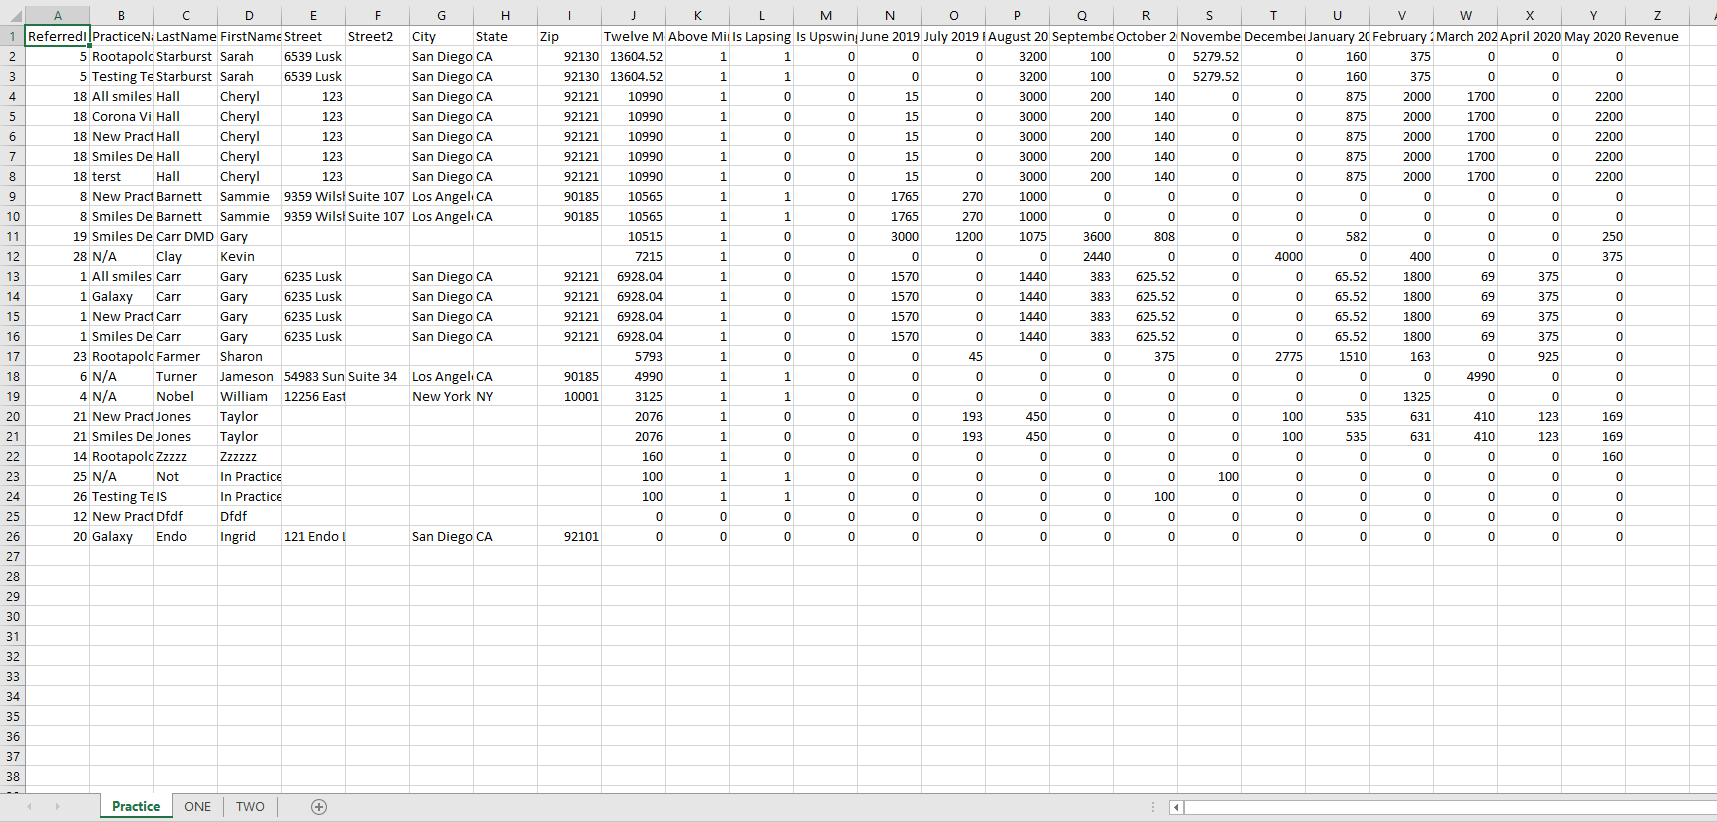
Referrer Revenue Alerts
This report will show revenues by referring doctor. This report will show the total revenue for the year specified as well as the average.
Above Minimum: Last 12 month total from the date back
Lapsing Minimum: Lists referring doctors that had not had revenue for the last two months, yet met a minimum revenue requirement.
Upswing minimum: Lists the referring doctors that have had revenue the month selected and are under the minimum revenue requirement.
The report shows the revenue month-by-month for the last 12 months. For instance
The report can be viewed by practice as well as by location
Reports Year
Reports Month: enter the month (in number) to start the review
Revenue Minimum: Enter the minimum amount to review
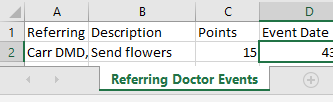
Referring Doctor Events
Report allows you to look up one Referring Doctor and the events for that Dr
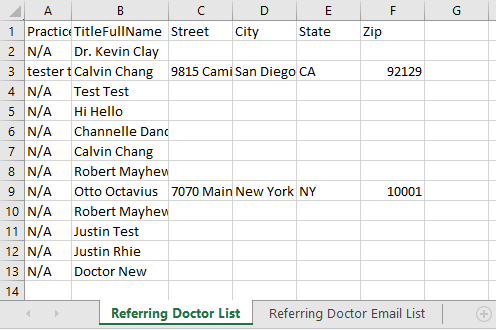
Referring Doctor List by Created Date
This report will allow users to have a list of all referring doctors added in the system on a given date range. This reports will be useful for mail merges. This report has two lists: Referring Doctor List in one of the tabs and the Referring Doctor Email List.
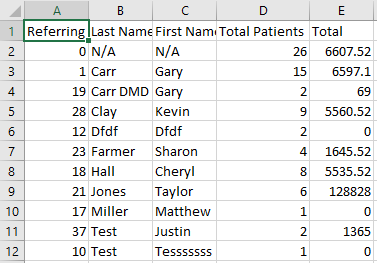
Referring Doctor Total Patients and Total Billed
The referral ranking report is the perfect place to see any tooth added to a record from a specific date range grouped by referring doctor and total production for those patients/teeth.
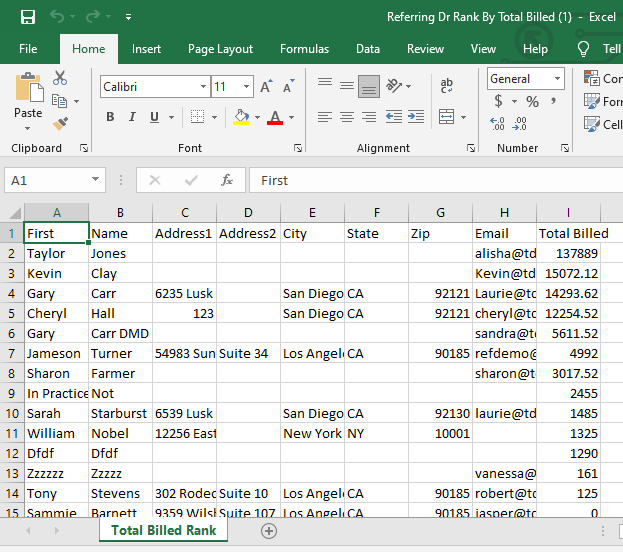
Referring Dr. Rank by Total Billed
The referral ranking report is the perfect place to see a list of how your referring doctors rank based on Total Billed.